Research Brief · Published · 8 min read
India MSME and Digital Access Statistics: Verified 2026 Data
Sixty official-source observations on Indian MSME registration and internet access, with source links, dates and cautions against conflating subscriptions with SEO adoption.
- India MSME Statistics
- India Internet Subscribers
- TRAI
- Udyam
- Digital Access
- 2026
Sources checked: 14 October 2026. MSME registration snapshot: 13 October 2026. TRAI quarter: April–June 2026, released 12 October 2026.
Before discussing India's digital business opportunity, we need to distinguish how many businesses are registered, how many internet subscriptions exist, and how many relevant people can find a particular business. Those are three different measurements.
This sourcebook collects 60 traceable official-source observations from the Ministry of Micro, Small & Medium Enterprises (MSME) and the Telecom Regulatory Authority of India (TRAI). Neither measures the number of businesses using SEO or AI-search optimisation, marketing-agency quality, qualified enquiries, or Tractionora's own adoption.
Eight headline facts and what they mean
- MSME registrations: The government dashboard reported 98,519,297 Udyam and UAP registration records as of 13 October 2026. It is an administrative count, not a census of active firms. MSME.
- Two registration routes: 54,685,350 Udyam records and 43,833,947 UAP records comprised that total. Do not double-count them. MSME.
- Enterprise size: The dashboard listed 97,932,457 micro, 544,825 small, and 42,015 medium registration records. MSME.
- Business activity: 19,412,450 manufacturing, 38,023,198 service and 41,083,558 trading registration records. These figures do not report e-commerce adoption. MSME.
- Internet subscriptions: TRAI reported 1,114.17 million subscriptions at the end of June 2026 compared with 1,092.79 million at the end of March. Quarterly growth was 1.96%. TRAI.
- Urban and rural internet: 666.09 million subscriptions were reported as urban and 448.08 million as rural in June 2026. TRAI.
- Broadband: TRAI recorded 1,087.50 million broadband internet subscriptions in June 2026. TRAI.
- Data use: Average wireless data use was 28.39 GB per subscriber per month during April–June 2026. Neither this nor subscriber totals measure search intent. TRAI.
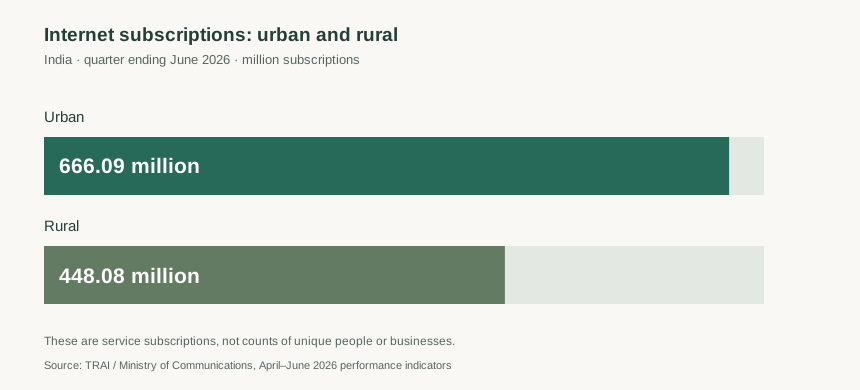
India's June 2026 internet-subscription counts by geography. Download the 60-observation CSV.
How many MSMEs are registered in India?
The Ministry of MSME's dashboard is updated frequently; the following observations record the 13 October 2026 snapshot, with earlier programme-specific dates where stated. Enterprise records and programme counts are not necessarily disjoint populations.
Udyam, UAP, enterprise size and business activity
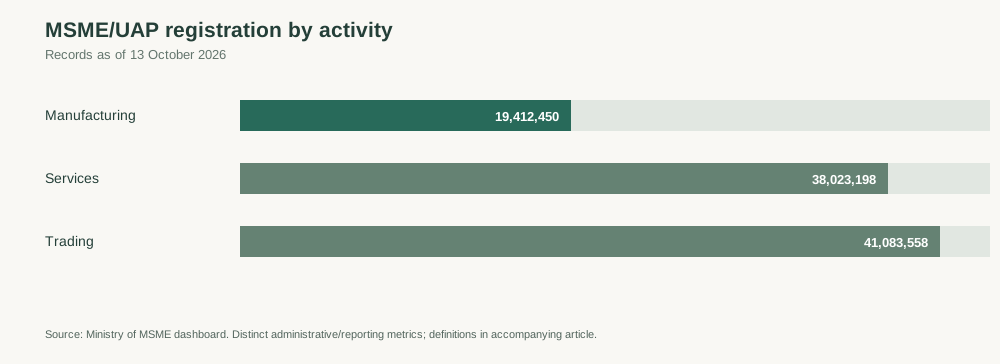
Activity registrations are administrative records, not a measure of how many businesses sell online.
- MSME/UAP registrations total (13 Oct 2026): 98,519,297 registrations. Original source.
- Udyam registrations (13 Oct 2026): 54,685,350 registrations. Original source.
- Udyam Assist Platform registrations (13 Oct 2026): 43,833,947 registrations. Original source.
- Micro enterprises registered (13 Oct 2026): 97,932,457 registrations. Original source.
- Small enterprises registered (13 Oct 2026): 544,825 registrations. Original source.
- Medium enterprises registered (13 Oct 2026): 42,015 registrations. Original source.
- Male category registrations (13 Oct 2026): 60,995,418 registrations. Original source.
- Female category registrations (13 Oct 2026): 37,062,181 registrations. Original source.
- Other gender category registrations (13 Oct 2026): 447,750 registrations. Original source.
- Manufacturing registrations (13 Oct 2026): 19,412,450 registrations. Original source.
- Service registrations (13 Oct 2026): 38,023,198 registrations. Original source.
- Trading registrations (13 Oct 2026): 41,083,558 registrations. Original source.
Demographic categories and programme indicators
- SC category registrations (13 Oct 2026): 10,266,574 registrations. Original source.
- ST category registrations (13 Oct 2026): 3,520,110 registrations. Original source.
- OBC category registrations (13 Oct 2026): 31,998,997 registrations. Original source.
- Divyangjan category registrations (13 Oct 2026): 779,623 registrations. Original source.
- Employment generation dashboard figure (13 Oct 2026): 436,010,502 reported jobs. Original source.
- ZED registrations (31 Aug 2026): 1,027,750 registrations. Original source.
- ZED certifications (31 Aug 2026): 732,058 certifications. Original source.
- LEAN registrations (31 Aug 2026): 68,740 registrations. Original source.
- LEAN basic certifications (31 Aug 2026): 19,807 certifications. Original source.
- RAMP beneficiaries (12 Oct 2026): 6,349,936 reported MSMEs. Original source.
- SFURTI artisans benefited (13 Oct 2026): 298,580 people. Original source.
- CGTMSE guarantees (31 Jul 2026): 14,937,092 guarantees. Original source.
- CGTMSE guarantee value (31 Jul 2026): 1,512,345 ₹ crore. Original source.
- MSME skilling trainees (31 Aug 2026): 4,352,706 people. Original source.
How many internet subscriptions does India have?
TRAI compiles quarterly statistics primarily from provider submissions. A subscription is a commercial connection, not a unique person, household or customer. Density per 100 people can exceed 100 when people hold multiple subscriptions.
Internet subscriptions, broadband and urban/rural distribution
- Internet subscriptions (30 Jun 2026): 1,114.17 million. Original source.
- Internet subscriptions prior quarter (31 Mar 2026): 1,092.79 million. Original source.
- Internet-subscription quarterly growth (Mar–Jun 2026): 1.96 %. Original source.
- Broadband subscriptions (30 Jun 2026): 1,087.5 million. Original source.
- Narrowband subscriptions (30 Jun 2026): 26.67 million. Original source.
- Wired internet subscriptions (30 Jun 2026): 47.73 million. Original source.
- Wireless internet subscriptions (30 Jun 2026): 1,066.43 million. Original source.
- Urban internet subscriptions (30 Jun 2026): 666.09 million. Original source.
- Rural internet subscriptions (30 Jun 2026): 448.08 million. Original source.
- Internet subscriptions per 100 residents (30 Jun 2026): 77.94 per 100 people. Original source.
- Urban internet subscriptions per 100 residents (30 Jun 2026): 129.03 per 100 people. Original source.
- Rural internet subscriptions per 100 residents (30 Jun 2026): 49.07 per 100 people. Original source.
- Broadband quarterly growth (Mar–Jun 2026): 2.03 %. Original source.
- Broadband prior quarter (31 Mar 2026): 1,065.88 million. Original source.
- Narrowband prior quarter (31 Mar 2026): 26.91 million. Original source.
Mobile data and Wi-Fi activity
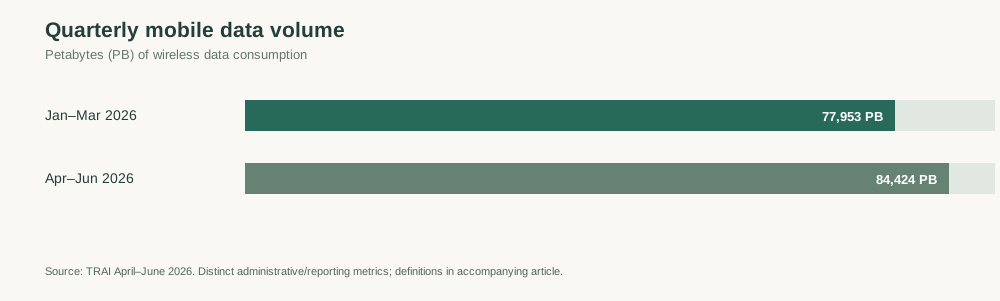
Official TRAI reporting shows increased traffic volume; it does not identify which websites or search services people used.
- Wireless mobile data subscriptions (30 Jun 2026): 1,045.55 million. Original source.
- Wireless mobile data subscriptions prior quarter (31 Mar 2026): 1,026.75 million. Original source.
- Quarterly wireless mobile data volume (Apr–Jun 2026): 84,424 PB. Original source.
- Prior-quarter wireless mobile data volume (Jan–Mar 2026): 77,953 PB. Original source.
- Quarterly wireless data volume growth (Mar–Jun 2026): 8.3 %. Original source.
- Average mobile data per subscriber per month (Apr–Jun 2026): 28.39 GB. Original source.
- Prior-quarter average mobile data per month (Jan–Mar 2026): 26.7 GB. Original source.
- Public Wi-Fi hotspots (30 Jun 2026): 55,233 hotspots. Original source.
- Public Wi-Fi hotspot data use (Apr–Jun 2026): 7,541 TB. Original source.
Telecom-service context that should not be confused with internet users
- Total telephone subscriptions (30 Jun 2026): 1,348.08 million. Original source.
- Urban telephone subscriptions (30 Jun 2026): 792.06 million. Original source.
- Rural telephone subscriptions (30 Jun 2026): 556.01 million. Original source.
- Urban telephone density (30 Jun 2026): 153.43 per 100 people. Original source.
- Rural telephone density (30 Jun 2026): 60.89 per 100 people. Original source.
- Wireless mobile subscriptions (30 Jun 2026): 1,282.38 million. Original source.
- Wireless fixed-access subscriptions (30 Jun 2026): 17.87 million. Original source.
- Wireline telephone subscriptions (30 Jun 2026): 47.82 million. Original source.
- Urban wireline subscriptions (30 Jun 2026): 42.68 million. Original source.
- Rural wireline subscriptions (30 Jun 2026): 5.15 million. Original source.
Why one widely quoted rate needs source reconciliation
The 12 October TRAI announcement contains an internal typo. A sentence states that quarterly internet-subscription growth was “96%,” but the published counts move from 1,092.79 million to 1,114.17 million, and the release's own snapshot table says 1.96%.
Calculation: (1,114.17 − 1,092.79) ÷ 1,092.79 × 100 = about 1.96%. We use the reconciled figure rather than repeating the erroneous narrative sentence. Original TRAI release.
Does this mean millions of MSMEs actively use SEO or AI search?
No. These sources contain no representative measurement of which MSMEs have websites, buy agency services, publish SEO content, appear in AI answers or receive qualified inbound leads. The data establishes a large formalisation and connectivity context, but not the addressable market for a particular software subscription.
Similarly, a telephone subscription is not the same as an internet subscription; multiple subscriptions may belong to one person. We preserve these distinctions rather than inflate a market-size claim.
For founders, the next useful question is much narrower: which customers can find this specific business, what prevents them from enquiring, and which evidence-backed change is worth making first? That is the intended direction of Tractionora, an independent SaaS platform currently in development and controlled preview.
Primary sources and reuse notes
- Ministry of Micro, Small & Medium Enterprises, official performance dashboard; the displayed general registration snapshot is 13 October 2026. Specific programme counters have their own date in each entry.
- TRAI / Ministry of Communications, Indian Telecom Services Performance Indicators, April–June 2026, published 12 October 2026; subscriptions and internet service statistics as of 30 June 2026.
Download: 60 sourced observations in CSV format. Each record includes its exact unit, period, link to the original government source and a scope note. This is an editorial compilation, not an original survey or a government-issued dataset.
Last reviewed: 14 October 2026. Next planned review: January 2027 or when a new official quarterly source materially supersedes these figures. The URL intentionally has no year; older measurements must retain their reference dates instead of being silently overwritten.